HydroBOT walkthrough
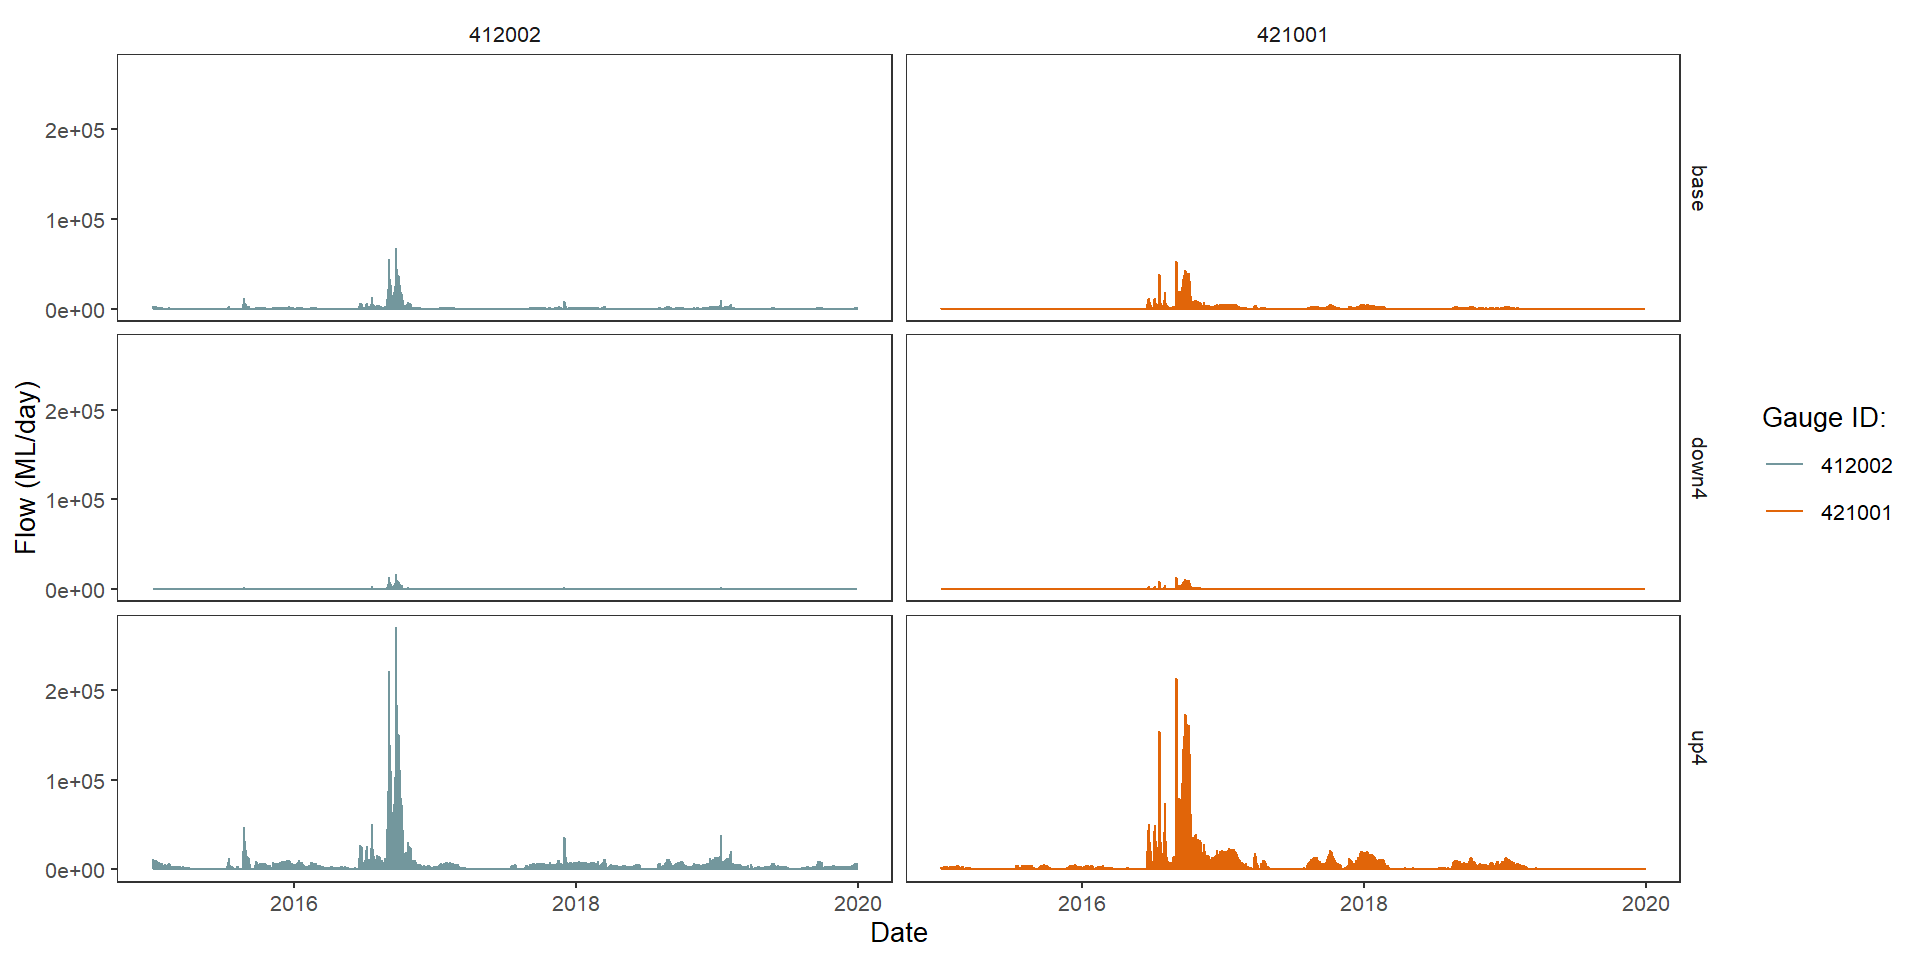
Full HydroBOT run

library(HydroBOT)
library(sf)
library(dplyr)
  • Many options we could set

  • See options at HydroBOT_website

  • Can run with minimal arguments

User arguments

  • Paths to input

  • Paths to save output

  • Module arguments (minimal)

  • Aggregation sequence and functions

Paths

# Outer directory for scenario
project_dir <- file.path("hydrobot_scenarios")

# Hydrographs (expected to exist already)
hydro_dir <- file.path(project_dir, "hydrographs")

# Generated data
# EWR outputs (will be created here in controller, read from here in aggregator)
ewr_results <- file.path(project_dir, "module_output", "EWR")

# outputs of aggregator. There may be multiple modules
agg_results <- file.path(project_dir, "aggregator_output")

EWR controls

  • Other modules as they are available
outputType <- list("yearly")
returnType <- list("none")

Aggregation sequencing

  • Sequence of steps

  • Sequence of functions

aggseq <- list(
  all_time = "all_time",
  ewr_code = c("ewr_code_timing", "ewr_code"),
  env_obj = c("ewr_code", "env_obj"),
  sdl_units = sdl_units,
  Specific_goal = c("env_obj", "Specific_goal"),
  catchment = cewo_valleys,
  Objective = c("Specific_goal", "Objective"),
  mdb = basin,
  target_5_year_2024 = c("Objective", "target_5_year_2024")
)


funseq <- list(
  "ArithmeticMean",
  c("CompensatingFactor"),
  c("ArithmeticMean"),
  c("ArithmeticMean"),
  c("ArithmeticMean"),
  "SpatialWeightedMean",
  c("ArithmeticMean"),
  "SpatialWeightedMean",
  c("ArithmeticMean")
)

Run HydroBOT

Typically automatically

  • Run hydrographs through modules

  • Aggregate and save responses

  • Comparisons/analyses

Module

  • Currently just EWR

  • Where are hydrographs

  • Where to save output

ewr_out <- prep_run_save_ewrs(
  hydro_dir = hydro_dir,
  output_parent_dir = project_dir,
  outputType = outputType,
  returnType = returnType
)

Aggregator

Returning instead of saving for presentation

  • Sequence (levels of each theme, space, time axis)

  • Aggregation functions at each step

agged_data <- read_and_agg(
  datpath = ewr_results,
  type = "achievement",
  geopath = bom_basin_gauges,
  causalpath = causal_ewr,
  groupers = "scenario",
  aggCols = "ewr_achieved",
  aggsequence = aggseq,
  funsequence = funseq,
  saveintermediate = TRUE,
  namehistory = FALSE,
  keepAllPolys = FALSE,
  returnList = TRUE,
  savepath = NULL
)

Outputs

  • Standardised formats using plot_outcomes function

  • Different plots for different purposes

  • Small selection follows

<colors>
#73979DFF #DADCD7FF #43200EFF #E16509FF 

Input hydrographs

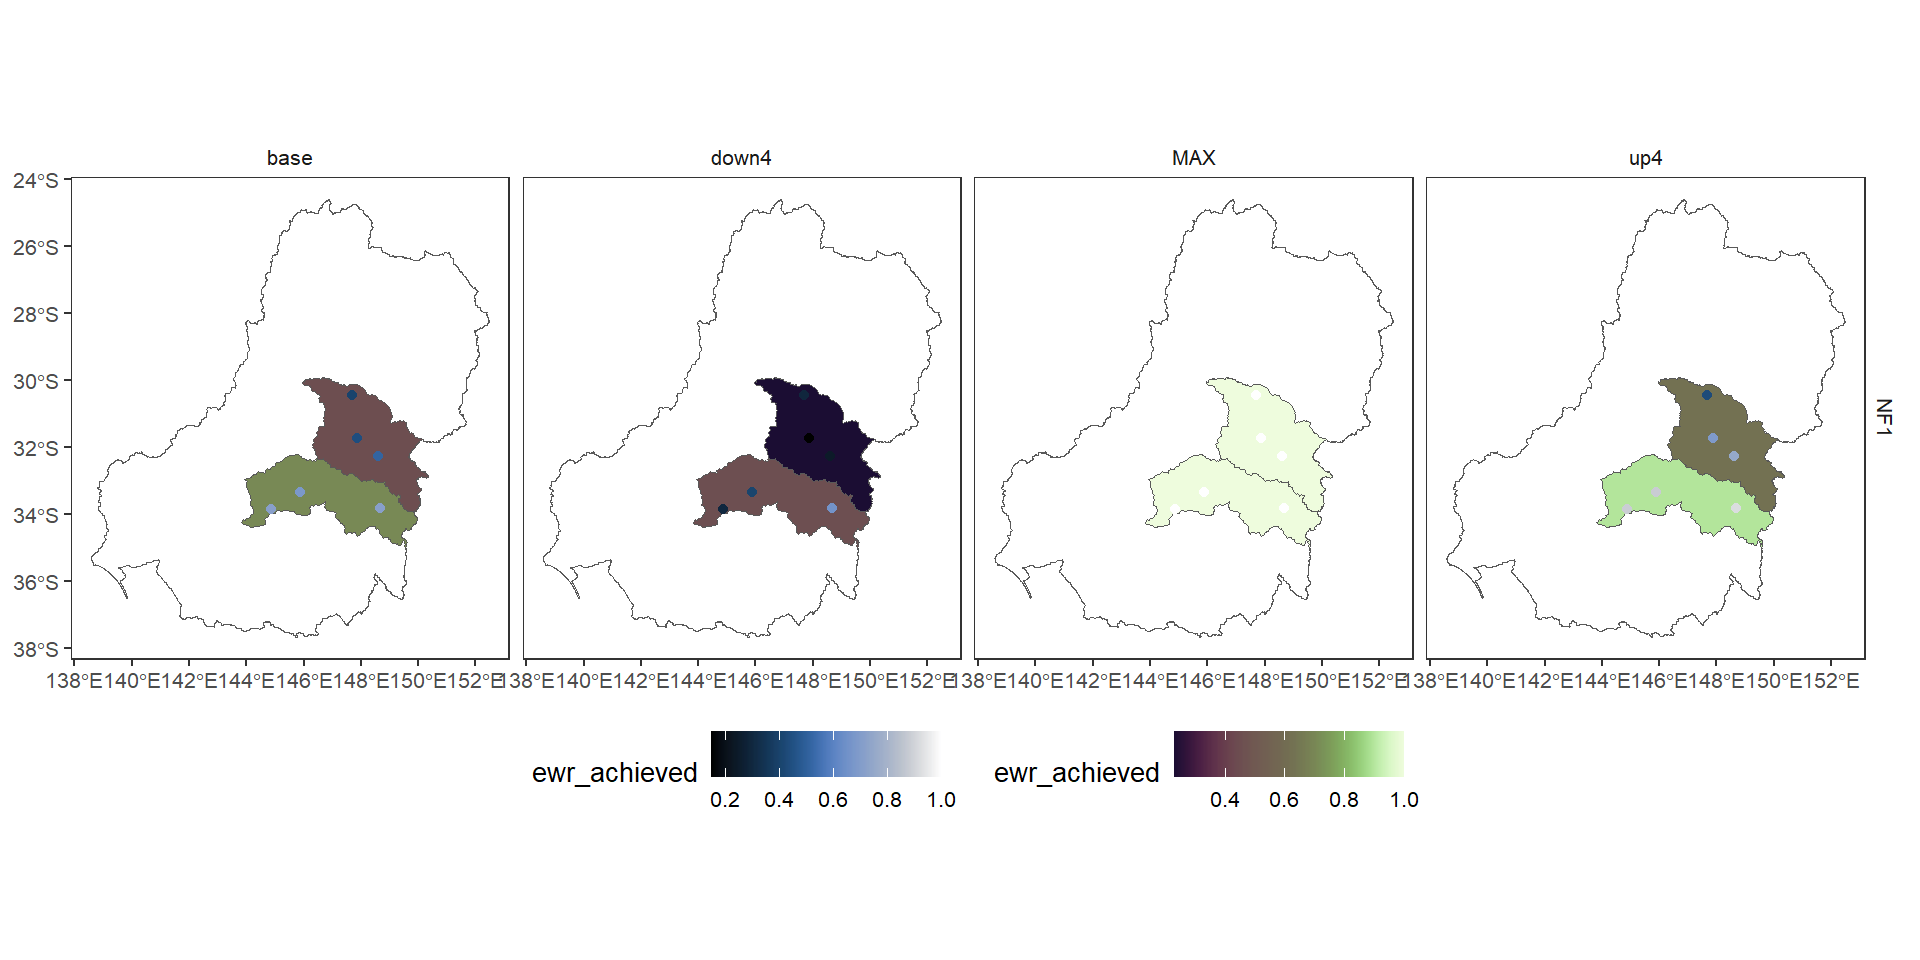
Maps and spatial scaling

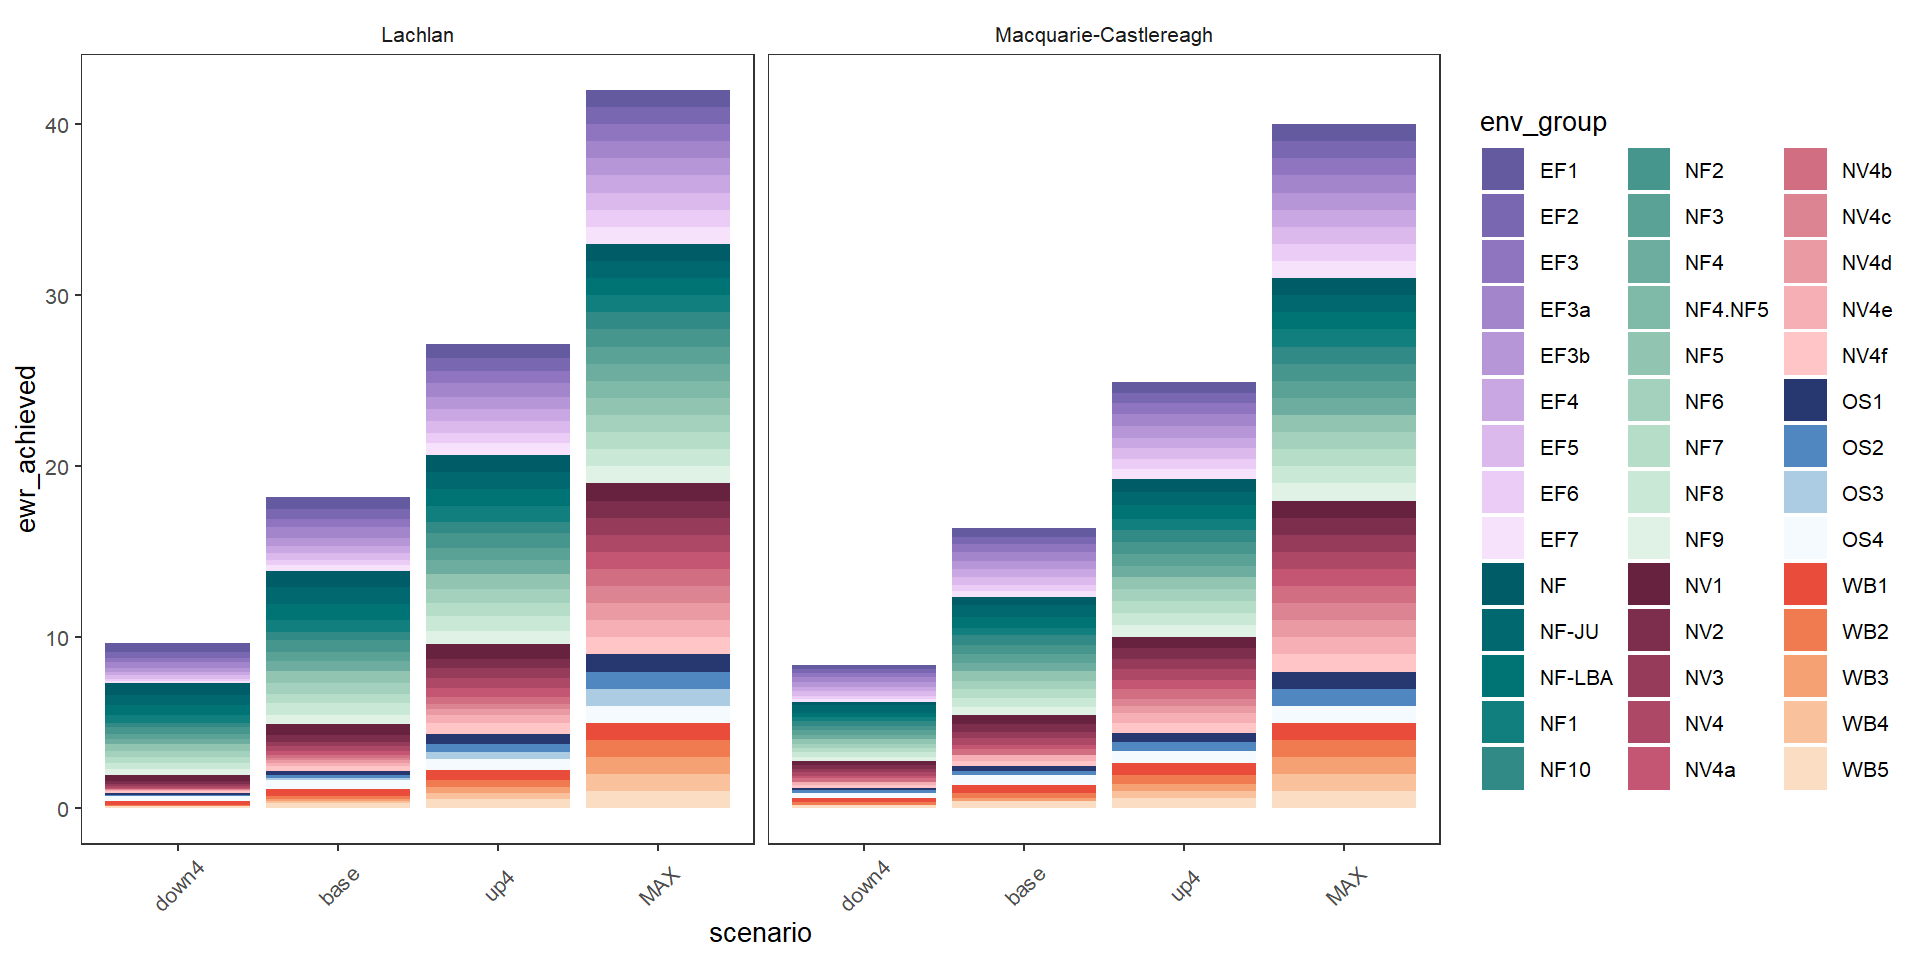
Bars- SDL units and scenarios

SDL unit differences in all environmental objectives

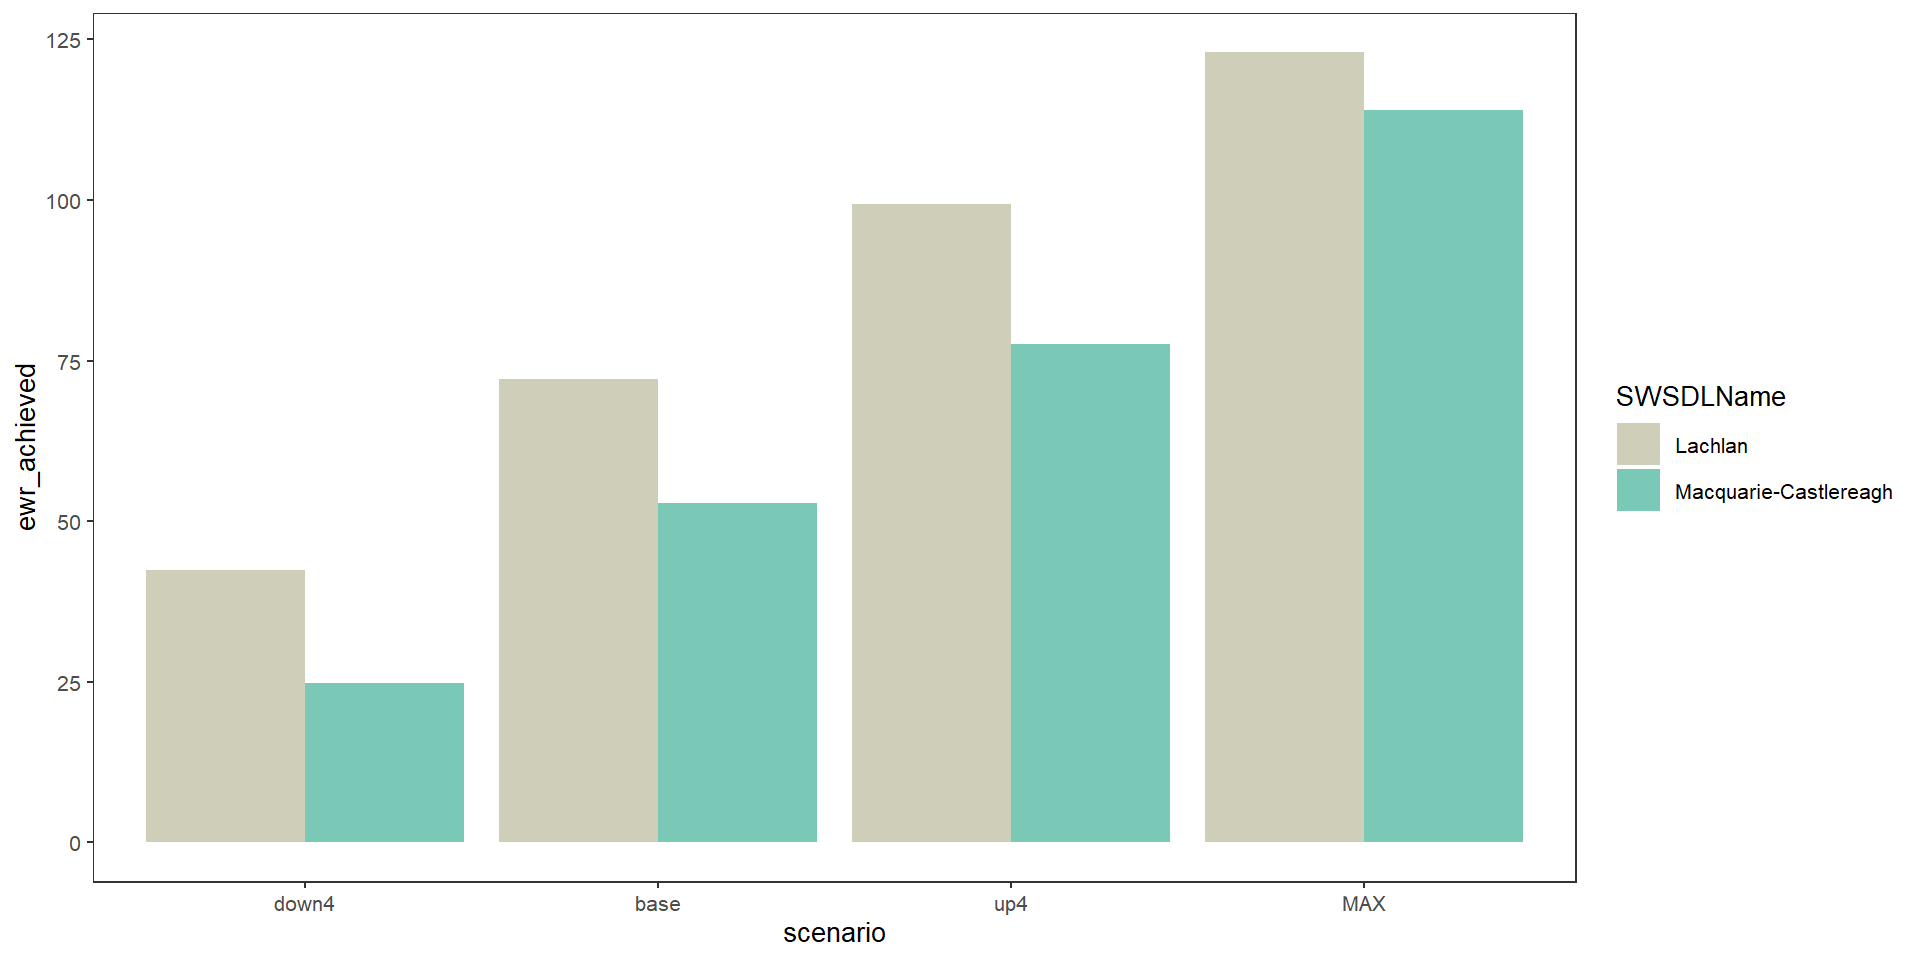
Objective and scenario comparisons
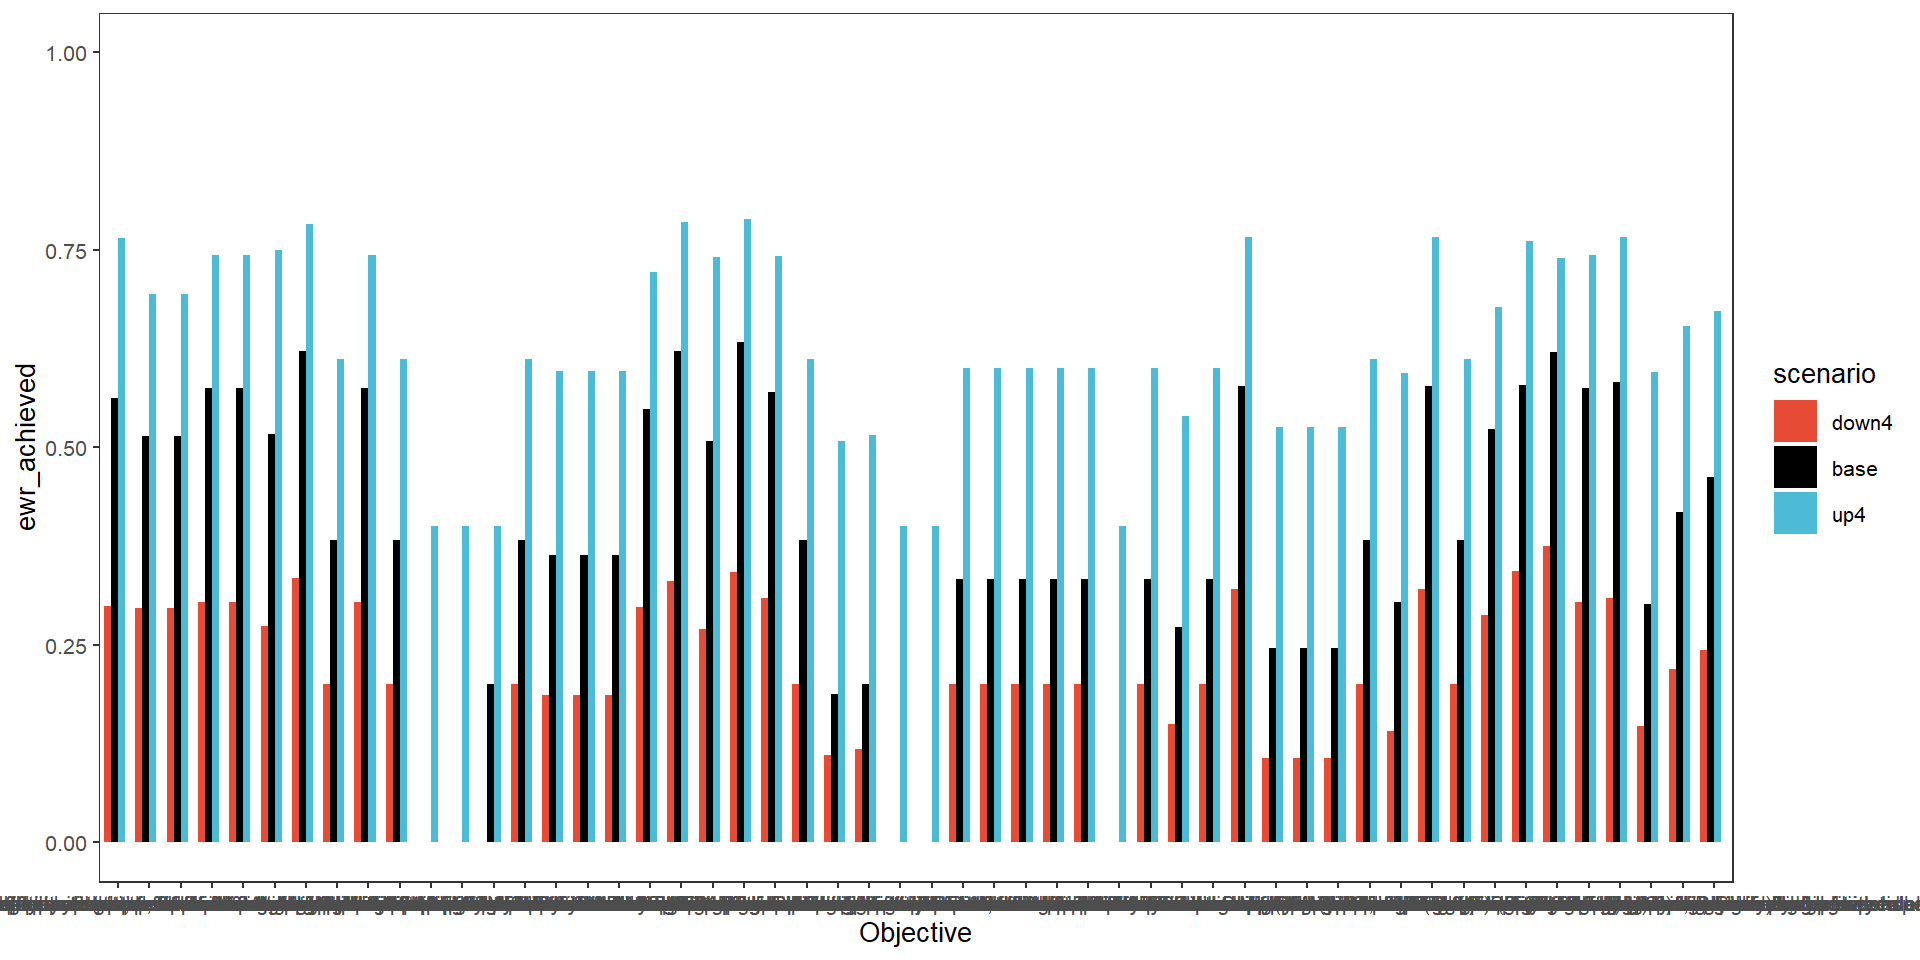
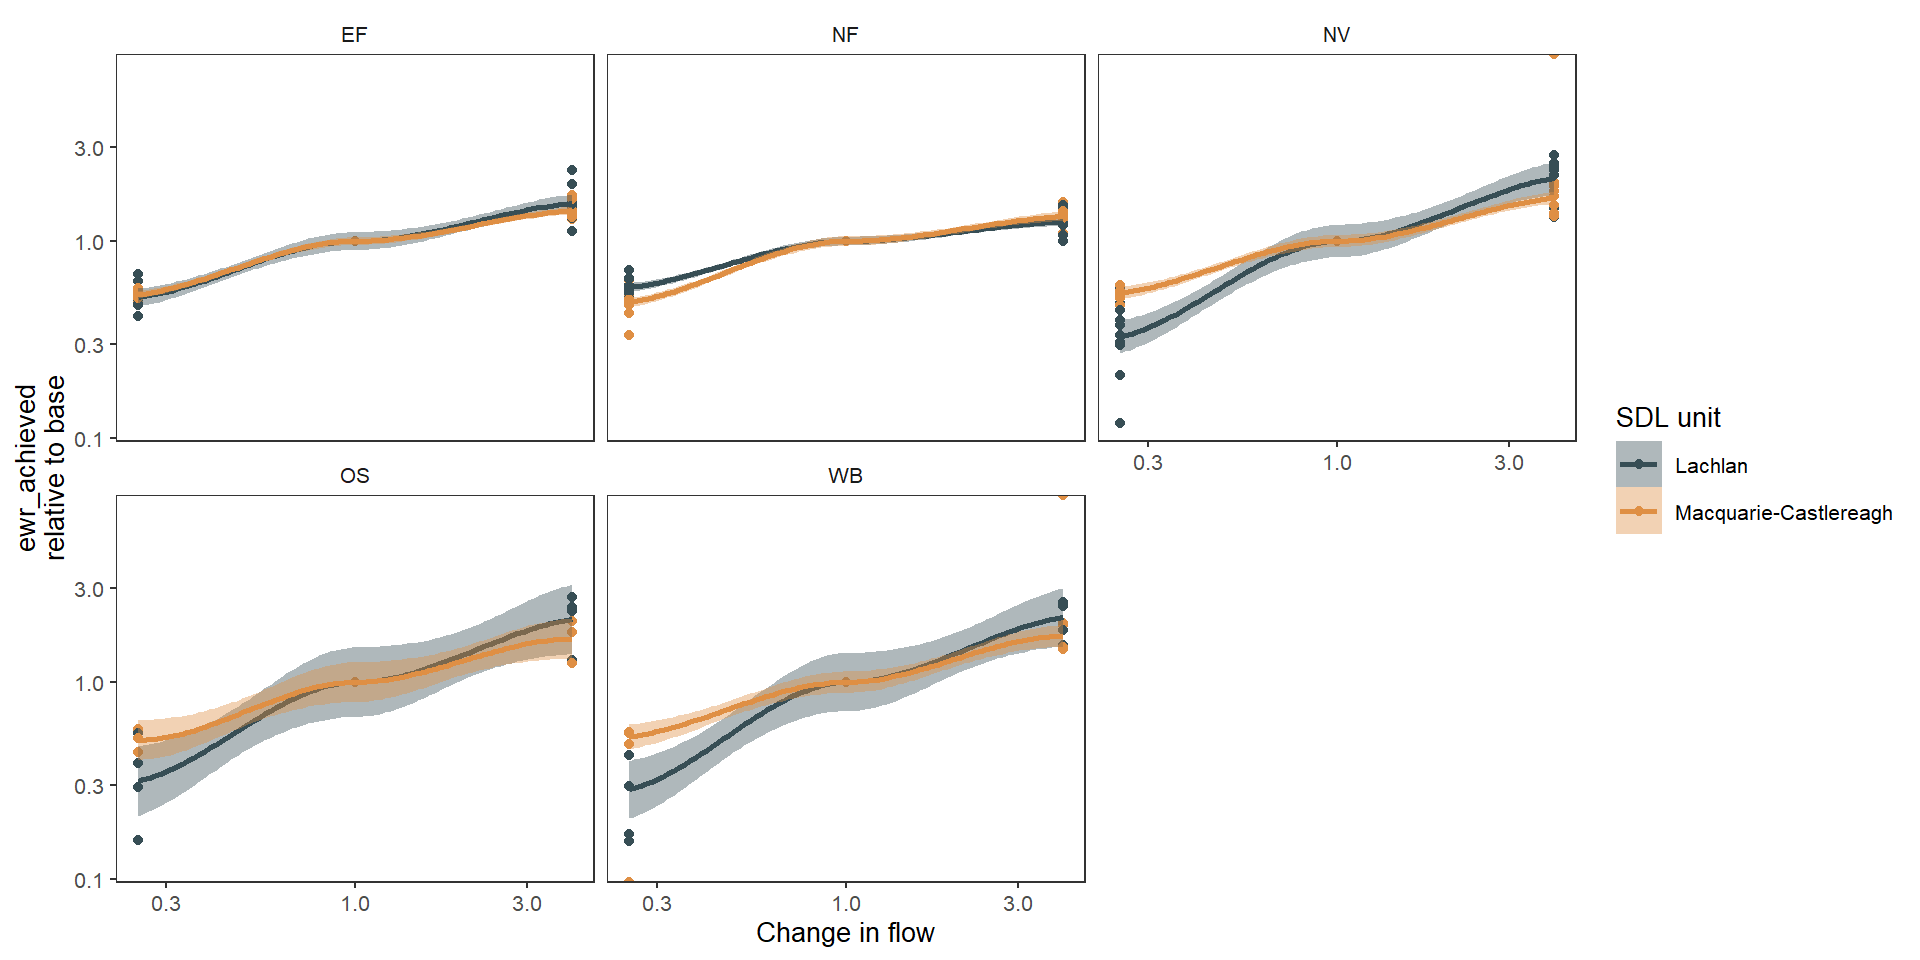
Lines and baseline

Change relative to baseline available to all plots

  • Disproportionate response
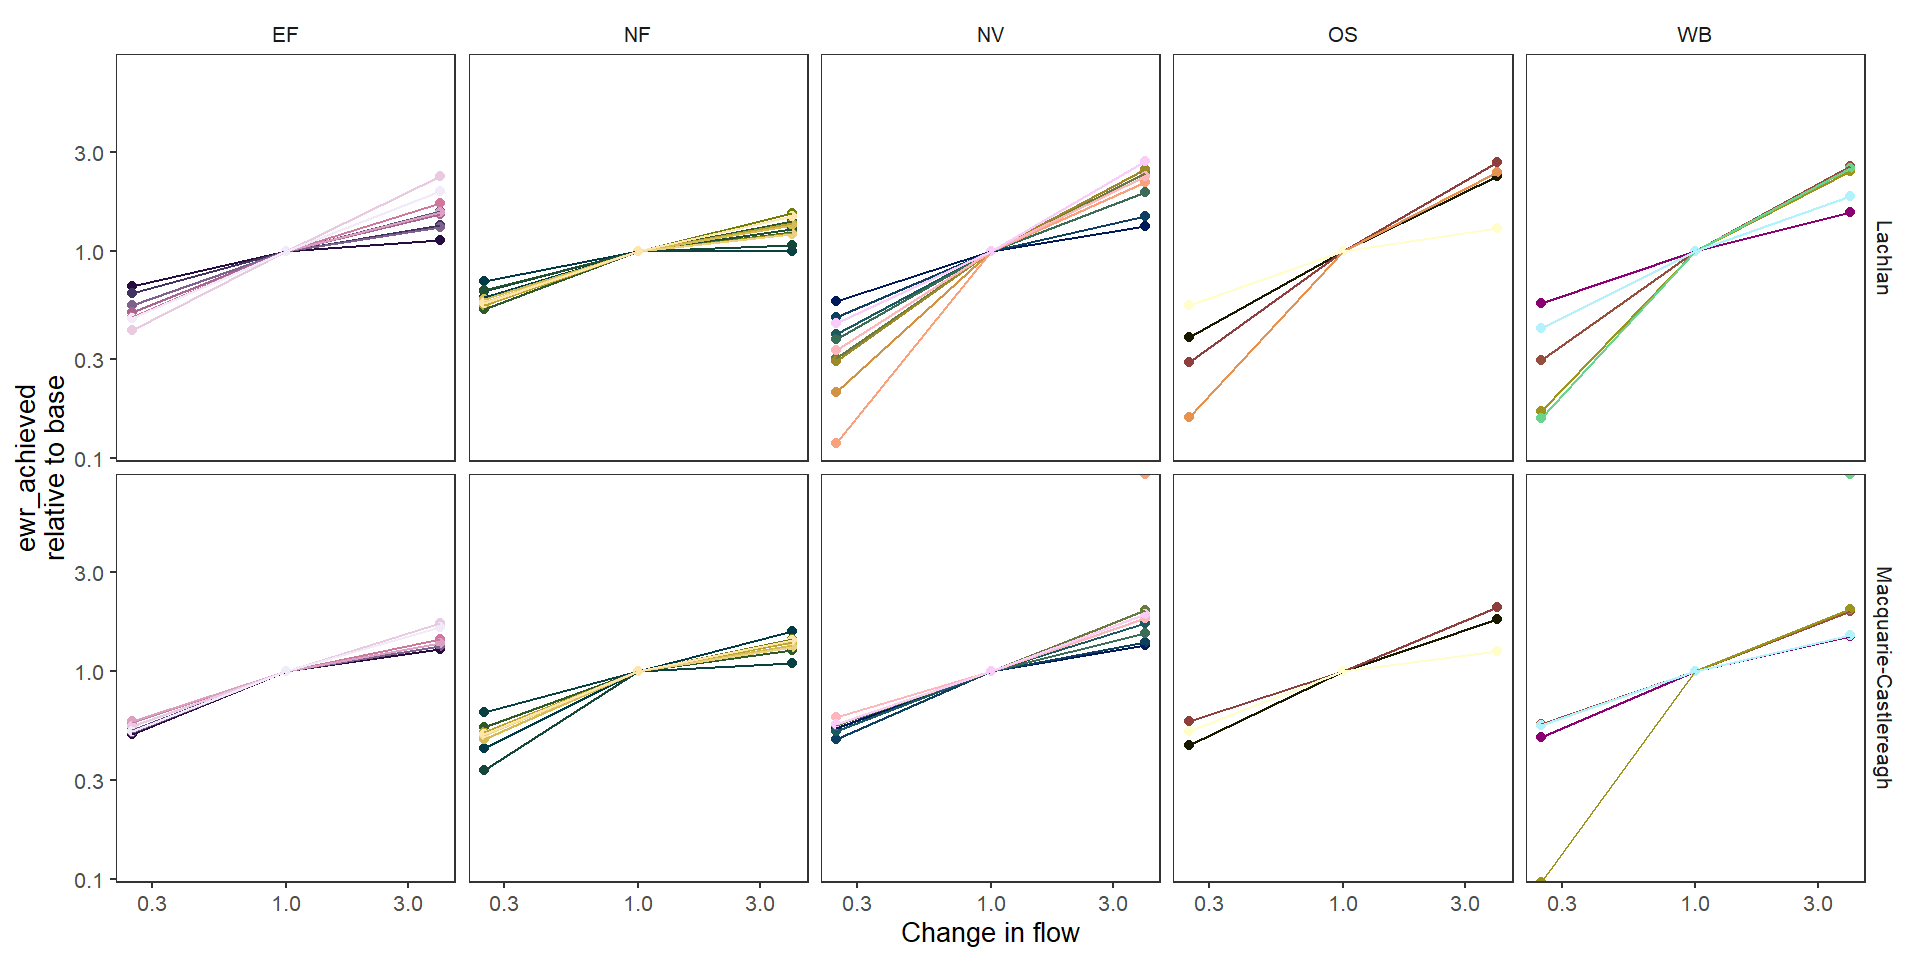
Fits

Smoothed fit of all environmental objectives in each group

  • Relative to baseline

Causal networks

Where next?

  • Real scenarios
    • Flow scaling

    • Case study

  • Capacity extension
    • Modules

    • Aggregation

    • Azure/large runs

  • Socialisation
    • Users/maintainers/builders

    • Output needs and targets

    • Links to other programs